| Issue |
Sust. Build.
Volume 8, 2025
|
|
|---|---|---|
| Article Number | 1 | |
| Number of page(s) | 12 | |
| Section | Smart Monitors and Intelligent Building Controls | |
| DOI | https://doi.org/10.1051/sbuild/2025001 | |
| Published online | 06 June 2025 | |
Original Article
Coupling of green building construction based on particle Swarm optimizing neural network algorithm
Northwest Branch, China Construction Eighth Engineering Division Corp., Ltd, Xi'an 710000, PR China
* e-mail: This email address is being protected from spambots. You need JavaScript enabled to view it.
Received:
24
May
2024
Accepted:
10
April
2025
Abstract
In the continuous development of the green building industry, construction safety management faces increasing challenges, particularly in safety and environmental protection, which requires precise evaluation and control. Therefore, this study proposes a coupling analysis method for green building construction based on particle swarm optimisation neural network. The purpose is to strengthen safety risk management in green building construction by combining particle swarm optimisation with neural network algorithms. A risk coupling performance comparison was conducted between traditional and research algorithms. In the results, when using a back propagation neural network for prediction, the actual construction risk rate increased from 0.235 to 0.431. the optimised algorithm showed an increase from 0.168 to 0.453, and the prediction error improving from −0.352 to 0.014, demonstrating a high degree of adaptability and accuracy to actual changes. Compared with traditional methods, the prediction error of this algorithm is significantly reduced, and the data fitting accuracy is improved to 0.99809, indicate its effectiveness in predicting construction safety risks. The research results not only contribute to improving the efficiency of safety management during the construction process, but also provide technical support for risk prediction models in the future green building field.
Key words: Particle swarm optimisation / BP algorithm / construction safety / risk coupling / green buildings
© L. Wang et al., Published by EDP Sciences, 2025
 This is an Open Access article distributed under the terms of the Creative Commons Attribution License (https://creativecommons.org/licenses/by/4.0), which permits unrestricted use, distribution, and reproduction in any medium, provided the original work is properly cited.
1 Introduction
As the concept of global sustainable development emerges, green building serves as a key approach to reducing environmental impact, and its risk management in the construction is gradually gaining attention [1]. In today's rapidly developing economy, resources are becoming increasingly scarce and environmental protection pressures are increasing. Green Building Construction (GBC) not only must deliver economic benefits but also minimise adverse impacts on the ecological environment [2]. However, The GBC process is complex and involves the influence of multiple variables, such as material supply, energy consumption control, waste management, and labour safety, among which involving complex interdependencies [3]. Traditional risk management methods such as linear programming and single-objective optimisation struggle to accurately identify and disentangle these intertwined risk factors, thereby limiting the effectiveness of risk prevention and control measures [4]. Particle Swarm Optimisation (PSO) offers simplicity, ease of implementation, and high efficiency. As an efficient intelligent optimisation method, it has significant advantages in optimisation problems of multi-parameter complex systems [5]. However, existing research still exhibits limitations in existing research in dealing with complex nonlinear problems, especially in the dynamic identification and timely feedback of risk factors. In response to the above issues, the study proposed to optimise a neural network using PSO, to enhance its ability to address complex coupling relationships and improve the ability to identify and manage complex construction risks. The study innovatively combined the deep learning capabilities of PSO and Back-Propagation neural network (BPNN), enabling them to quickly learn and adapt under multivariate interactions, and achieved self-optimisation in risk prediction and management. This approach aims to provide GBC with a new methodology and technical support for risk assessment and control.
PSO is an algorithm inspired by simulating the predatory behavior of bird flocks, which guides group optimisation through information sharing among individuals to solve complex optimisation problems. BPNN has certain advantages in dealing with nonlinear problems. The combination of these two algorithms attracts the attention of many scholars. Jiao et al. proposed a quantum PSO based on elite adversarial learning strategy. The algorithm was validated through performance testing and theoretical model comparison to provide more accurate posterior estimation of the real model. These studies confirmed that compared to traditional PSO, this algorithm had higher solving accuracy and computational efficiency in transient electromagnetic data inversion, optimizing multi-solution and ill posed problems [6]. Wang et al. proposed an indoor multi-dimensional visible light localization method that integrated target attitude angles. Under different signal-to-noise ratio conditions, sub-centimeter level positioning accuracy was achieved, while ensuring that the angle errors of the target are mostly less than 5°. These studies confirmed that this method improved the accuracy and stability of localization through adaptive PSO [7]. Huan proposed an interval decomposition related PSO extreme learning machine model to improve the accuracy of long-term water quality prediction. This model had better short-term prediction accuracy and long-term stability than other prediction algorithms when processing data from the Haihe River Basin in Beijing. These studies confirmed that this model was suitable for predicting water quality in areas with high potential pollution threats [8]. Liu et al. proposed a fractional order total variation infrared image denoising model that integrated pollination PSO, which integrated the pollination optimisation algorithm with the search capabilities of PSO. These studies confirmed that this model adaptively determined the optimal fractional order differential order and effectively denoised while preserving the texture details of infrared images [9]. Luo et al. proposed a PSO variant that integrated resistivity constraint matrix and damping factor for two-dimensional self-potential source inversion. These studies confirmed that the algorithm not only improved the exploratory and developmental capabilities in high-dimensional self-potential source inversion, but also ensured the compactness and smoothness of the inversion results. Its effectiveness was verified through case analysis, sandbox experiments, and on-site applications [10].
In GBC, construction safety risk management involves many risk factors, and there is a close coupling relationship between them. Identifying and decoupling these risk factors is critical for enhancing construction safety and reducing potential risks. Therefore, many scholars explore its coupling mechanism and optimisation strategies. Mavroulidis et al. undertook an examination of the occupational health and safety behavior of construction industry enterprises by evaluating their social responsibility reports. These studies confirmed that sampled companies were slow to respond to stakeholder demands for accountability for organizational behavior and consequences. These companies demonstrated limited engagement in other important issues such as labor representativeness, prevalence of high-risk roles, and supply chain security practices [11]. Erkal et al. proposed a building safety performance evaluation method based on prediction, objectivity, and effectiveness, combined with clarity, functionality, and importance as standards. Literature review and Delphi method were used to obtain expert opinions for evaluation. These studies confirmed that integrating multiple complementary indicators provided a more comprehensive evaluation of security systems and compensated for their respective shortcomings [12]. Zhang et al. proposed to explore the relationship between physical and mental fatigue and unsafe behavior of construction workers by combining simulated homework experiments with physiological measurement techniques. These studies confirmed that physical and mental fatigue significantly weakened the cognitive and motor functions of workers, and specific physiological signals were significantly correlated with cognitive and motor errors [13]. Guerreiro et al. developed an ultra-strong structural element for life-threatening seismic risks to protect building residents from life-threatening seismic risks. These studies confirmed that shelters still maintained a tolerable acceleration range for the human body under different impact conditions despite being subjected to multiple impacts during building collapse [14]. Durdyev et al. proposed using a fuzzy-based risk assessment method to assess occupational health and safety risks in green building projects, which combined the fuzzy Delphi method and the fuzzy best worst method. These studies confirmed that this method reduced environmental impacts and reduce occupational safety and health risks of workers, especially high-altitude falls and excessive fatigue [15].
In summary, PSO and its integrated applications demonstrate their powerful optimisation capabilities and wide applicability in multiple fields. However, current fusion algorithms are often used to solve specific problems. There is little research on risk identification and management methods for GBC. In this study, a combination of PSO and NN algorithm was proposed to address the coupling problem in GBC. By integrating this algorithm into GBC risk management, it is expected to achieve more efficient and intelligent risk identification and control, offering robust technical support for the sustainable development of the construction industry.
The research content mainly includes four parts. In the first part, a comprehensive literature review is presented the applications of PSO in various fields and the current research status of BPNN in handling complex problems. Then, the mechanism of PSO optimizing BPNN parameters is thoroughly studied, and its application in GBC security risk coupling is explored. In the second part, the first section provides an overview of the mechanism for optimizing BPNN parameters using PSO. The second section studies the GBC security risk coupling mechanism based on optimized BPNN. The third section comprehensively tests the performance of PSO optimizing BPNN, including algorithm testing, performance analysis, and evaluation and analysis of GBC security risk coupling methods. In the fourth part, there is a summary and outlook on the research methods and results of this study.
2 Materials and methods
The integration of PSO and BPNN provides new research ideas for GBC security risk management. The study first explores the mechanism of PSO in optimizing BPNN parameters. By simulating the social behavior of particle populations, PSO adjusts weights and biases to improve the convergence speed and prediction accuracy of the network. Secondly, the mechanism of the optimisation algorithm in GBC security risk coupling was studied. The coupling analysis of safety risks involves multiple risk factors and their interactions. By training an optimized NN and effectively identifying and evaluating construction risks, the dynamism and adaptability of GBC safety management can be improved.
2.1 Mechanism of PSO optimizing BPNN parameters
The complexity and uncertainty of safety factors in GBC require the model to have a high degree of adaptability and accuracy [16]. PSO achieves information sharing among individuals by simulating the predatory behavior of bird flocks, leading to the overall evolution towards a superior solution. Therefore, it adjusts the weight and bias in BPNN in multidimensional parameter space to capture the complex relationship between safety risks and construction in GBC. The parallel search mechanism of PSO in optimizing BPNN parameters can effectively avoid local optima, thereby improving the global optimisation ability [17]. Figure 1 shows the principle of BPNN.
BPNN is a type of multi-layer feedforward neural network, which receives data through the input layer and processes it through the hidden layer before outputting the results through the output layer [18]. In the forward propagation stage, input information is processed by each layer sequentially and transmitted to the output layer. If the output layer fails to obtain the expected result, the information proceeds to backpropagation. At this point, the error is propagated back proportionally to the weights, and the weights of each node are adjusted layer by layer to minimise the output error [19]. Assuming that the learning and training of BPNN includes forward and backward error propagation, forward propagation is expressed by equation (1).
 (1)
(1)
In equation (1), x refers to the input sample. The respective hidden layer outputs are represented by equation (2).
 (2)
(2)
In equation (2), n refers to the number of input layer nodes. wki refers to the weight from the input to the hidden layer. The range of i is 1, 2,..., n. The output of the output layer node is represented by equation (3).
 (3)
(3)
In equation (3), q refers to the number of output layer nodes. wjk refers to the weight value from the output layer to the hidden layer. The range of k is 1, 2,..., n. BPNN can effectively handle nonlinear problems and exhibits strong generalisation and adaptability. Figure 2 shows the process of BPNN.
The BPNN process starts with the initialization of the network structure, including setting the number of nodes and randomly assigning weights and biases [20]. In the forward propagation stage, the input data are weighted and summed by each layer and processed by an activation function, and then transformed layer by layer into the output layer. If there is a deviation between the output layer result and the target value, the algorithm enters the backpropagation phase [21]. By using gradient descent or other optimisation algorithms, the network parameters are iteratively updated to minimize the loss function [22]. When the actual output result of BPNN differs significantly from the expected value, the output deviation is considered the error E, represented by equation (4).
 (4)
(4)
In equation (4), dy refers to the expected value of the y th neuron node. dk refers to the output value of the kth hidden layer node. The range of k,y is 1, 2,..., n. θy refers to the hidden layer node threshold. The output error weight and threshold adjustment of BPNN are the main parameters that can reduce errors by adjusting the weights and thresholds. Firstly, the output value dj and the expected value oi are calculated, and then the resulting reverse error is input to the nodes in the input layer, represented by equation (5).
 (5)
(5)
In equation (5), wkj refers to adjusting the weights between the hidden layer and output layer nodes. wk denotes the backpropagated error. ok refers to the error of the k th hidden layer node. yk refers to the output layer node error. PSO seeks the optimal solution through collaboration and information sharing among particles. Figure 3 shows the process of PSO.
PSO initializes a group of random particles, each representing a point in the latent solution space. In each iteration, this algorithm updates the position and velocity of each particle by evaluating the objective function [23]. The speed update reflects the comprehensive consideration of individual cognition and group experience by each particle, while the position update pushes the particle towards the direction of individual and group optimal solutions [24–25]. The fitness of each particle is calculated, and the root mean square error RMSEa,b of the sample is used to represent the fitness in equation (6).
 (6)
(6)
In equation (6), ai, bi are the sample's actual and ideal output values, respectively. n refers to the number of samples. The algorithmic error is represented by equation (7).
 (7)
(7)
In equation (7), k refers to the current iteration of the algorithm.  refers to the fitness of the global optimal value for the ith iteration. The process of PSO-optimised BPNN integrates the global search capability of PSO and the powerful pattern recognition capability of BPNN. Figure 4 shows the process of PSO-optimised BPNN.
In the initial stage, each particle in the particle swarm refers to a set of weights and biases for BPNN. Firstly, based on these parameters, BPNN is initialized. Secondly, the particle swarm searches in the solution space according to the rules of PSO. The position update of each particle is guided by the individual's best historical position and the group's best historical position. This process continues until the preset iteration is reached or the fitness meets the established requirements.
 |
Fig. 1 Structure of the BPNN model. |
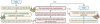 |
Fig. 2 Process of BPNN. |
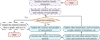 |
Fig. 3 PSO algorithm process. |
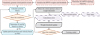 |
Fig. 4 Process of PSO-optimised BPNN. |
2.2 Coupling of safety risks in green building construction based on PSO-BPNN
In GBC safety, it is easy to become trapped in local optima in complex safety risk assessments, which limits the analysis of the coupling relationship between construction safety and environmental protection. In response to this issue, the study utilizes PSO to optimize BPNN to search for better weights and bias parameters on a global scale, thereby improving global optimisation performance for GBC security risk coupling. PSO-BPNN is used to identify and evaluate safety risks and environmental impacts during construction to more effectively assess the coupling state of construction risk management. Table 1 shows the coupling coupling levels in GBC risk management.
The coupling status level of GBC risk management is divided into three intervals: low, medium, and strong, to quantitatively describe the interaction strength between various risk factors in construction risk management [26–27]. The low coupling interval has weak mutual influence, and each factor is relatively independent. The coupling effect on the system is limited. There is a significant interaction between risk factors in the medium coupling interval, which has a moderate effect on system dynamics. The interaction between risk factors in strong coupling intervals is strong, and each factor is closely related. The combined effect has a significant impact on system stability and safety. By categorising coupling levels, the coupling degree of m risk coupling indicators is obtained, represented by equation (8).
 (8)
(8)
In equation (8), Um refers to the efficacy value of the coupling index on the safety system of the entire construction tower crane operation. To address common inaccuracies in coupling degree analysis, this study introduces a comprehensive coordination index T to refine the coupling degree model, represented by equation (9).
 (9)
(9)
In equation (9), C represents the corrected coupling degree, ranging from 0 to 1. T refers to the comprehensive coordination index. km represents the undetermined coefficient. Figure 5 shows the coupling relationships among human, material, environmental, and managerial risk factors in GBC.
In GBC, personnel safety, material management, environmental protection, and risk management form interconnected systems. Personnel safety is related to the compliance of construction operations and accident prevention. Material management directly affects engineering quality and cost control. Environmental protection is closely related to the sustainable concept and social responsibility of green buildings. Risk management coordinates the relationship between these three to ensure efficiency and safety during construction. The coupling degree T of green building safety risk is represented by equation (10).
 (10)
(10)
In equation (10), T4(a,b,c,d) denotes the coupling degree for human-material-environment-management risks. a denotes the risk factor associated with personnel. b denotes the material-related risk factor. c represents environmental risk factors. d denotes the management-related risk factor. The coupling degree of construction safety risk can accurately evaluate the coupled risks across human, material, environmental, and managerial domains. Based on this relationship, PSO-BPNN is used to optimize risk management strategies and develop a safety risk coupling framework. Figure 6 illustrates the safety risk coupling framework optimised by PSO-BPNN.
In the GBC risk coupling system, identifying risk factors is central to accurately capturing various variables that affect construction safety. The use of PSO to optimize the weights and thresholds of BPNN enhances learning capacity and generalisation performance of the network. The scores of various safety risk coupling indicators are translated into quantitative representations of qualitative concepts, including expected values Ex and entropy En. Ex is represented by equation (11).
 (11)
(11)
In equation (11), n denotes the number of evaluators. xi represents the evaluation result of the ith expert on the indicator. En is represented by equation (12).
 (12)
(12)
In equation (12), Ex represents the expected value of security risk coupling. The model-generated evaluation results can provide scientific basis for construction safety risk management and decision-making and inform the implementation of effective risk mitigation strategies.
Coupling status level of risk management in green building construction.
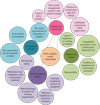 |
Fig. 5 Coupling relationships among human, material, environmental, and management risks in green building construction. |
 |
Fig. 6 Safety risk coupling framework based on PSO-optimised BPNN. |
3 Results
The study tested and the improvement in predictive accuracy of the model of PSO combined with BPNN in the GBC security. Firstly, by comparing the true and predicted values of BPNN and PSO-BPNN and analyzing the network error, the accuracy of improving the model's prediction of construction safety risks was validated. Secondly, a coupling analysis was conducted on the potential risk factors in GBC to evaluate the interactions between each risk factor. This model was employed to quantitatively assess safety risks, providing a theoretical foundation and empirical data for construction safety management.
3.1 Testing and performance analysis of PSO optimizing BPNN
To verify the effectiveness and reliability of the GBC security coupling study of this optimisation method, its performance was tested and analyzed. The experiment required careful configuration of system parameters to ensure high accuracy and repeatability of each calculation step when analyzing risk coupling relationships. The software configuration used Windows 10 professional edition as the operating system. All algorithms were implemented in the Python 3.8 environment and completed using the TensorFlow 2.4 framework to ensure sufficient computational power for BPNN training. For data processing, NumPy 1.20 and Pandas 1.3 tool libraries were used to ensure the computational efficiency and accuracy. The high-performance Samsung SSD 980 PRO 1TB solid-state drive was selected for hardware configuration to ensure data read and write speed. The experimental environment was set in a spacious 600 square meter GBC on-site simulation environment to simulate coupling risk scenarios in real construction contexts. Table 2 shows the experimental parameters.
A precisely configured system environment was established to construct a complete software and hardware environment for system testing and analysis to ensure the accuracy and precision of testing and analysis. Figure 7 shows the comparison between the predicted and true values of BPNN and PSO-BPNN.
In Figure 7a, under the prediction of PSO-BPNN, the risk rate of unexpected costs in construction projects showed an upward trend as the sample size increased. The actual risk rate increased from 0.235 to 0.431. During the same period, the risk rate predicted by BPNN showed a downward trend, decreasing from 0.383 to 0.009, indicating the gap between the algorithm's prediction and the actual situation. The corresponding prediction error increased from −0.246 to −0.009, and the absolute value of the error gradually decreased. In Figure 7b, under the prediction of BPNN, as the sample size increased, the risk rate of unexpected expenses in construction projects also showed an increase, from 0.168 to 0.453. The predicted starting value was 0.426, which decreased to 0.021 as the sample size increased, showing moderate adaptability and optimisation performance. The change in prediction error in this model from −0.352 to 0.014 indicated that the difference between the predicted and true values was decreasing. Therefore, under PSO-BPNN, the error between the true and predicted values was significantly reduced. Figure 8 shows the comparison of network errors between BPNN and PSO-BPNN.
In Figure 8a, as the iterations increased, the Mean Square Error (MSE) of both the training and testing sets of BPNN consistently decreased. At the beginning, the training set error was 9.031, and then it decreased to 0.061. The test set error decreased from 9.011 to 0.057, indicating that this model had good generalization ability on unknown data and verifying the effectiveness of BPNN in data fitting. In Figure 8b, as the iteration increased, PSO-BPNN further reduced predictive error. The training set error decreased from a high 8.741 to 0.073, and the test set error decreased from 8.903 to 0.082. The training set error reached the target MSE, while the testing set error approached the theoretical minimum MSE. Therefore, PSO-BPNN significantly improved the prediction accuracy and robustness of the model across complex datasets. To further verify the coupling degree of PSO-BPNN in actual safety risks, the coupling degree under different regression indicators was analyzed. Figure 9 shows the regression results of PSO-BPNN.
In Figure 9a, when the regression index reached 0.99809, as the target increased, most data points tightly wrapped around the regression line, showing a high degree of coupling. When the targets exceeded 1256, the distribution of data points was more compact. This indicated that this The model exhibited exceptionally high predictive accuracy for actual output, and the predicted and actual values had minimal discrepancy. The regression index of Figure 9b was 0.99047, and the data points remained loosely clustered around the regression line, indicating a low degree of coupling. However, when the target reached 1573, a strong coupling was evident. The regression index of Figure 9c was 0.99229, and the data points were generally not tightly coupled with the regression line, exhibited isolated coupling behaviour when the targets were 1492. In Figure 9d, the regression index was 0.99258. As the target increased, the data points showed a certain degree of coupling. Especially after reaching 1537 targets, the coupling between data points and regression lines became more significant. Therefore, PSO-BPNN had high regression accuracy, and different numbers of targets affected the coupling degree.
Experimental environmental parameters.
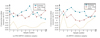 |
Fig. 7 Comparison of predicted and actual values of BPNN and PSO-BPNN. |
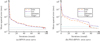 |
Fig. 8 Comparison results of network errors between BPNN and PSO-BPNN. |
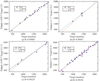 |
Fig. 9 Regression results of PSO-BPNN. |
3.2 Evaluation and analysis of coupling methods for safety risks in green building construction
By analyzing the performance data of PSO-BPNN, the coupling of GBC safety risks was evaluated and analyzed to identify key factors influencing construction safety, and then quantitatively evaluate the coupling relationship of construction safety risks. In addition, some parameters were adjusted. Intel Core i9-10900K was the AMD Ryzen 9 series, and Samsung SSD 980 PRO 2TB was selected. To ensure the accuracy and reliability of the proposed model, statistical methods validated model reliability. Figure 10 shows the PSO-BPNN reliability test results of GBC safety risk coupling analysis.
In Figure 10a, the time delay performance of GBC security risk coupling showed a gradually increasing trend at different complexities. When the risk factor was 100, the risk processing time delays of FTA, ETA, and PSO-BPNN were 37.85ms, 26.37ms, and 23.04ms, respectively. In Figure 10b, the processing time delay performance of PSO-BPNN construction safety risk coupling also showed a certain upward trend at different complexities. When the risk factor was 100, the risk processing time delays for FTA, ETA, and PSO-BPNN were 34.15ms, 30.09ms, and 25.17ms, respectively. However, when the risk factor was 48, the risk processing time delay of PSO-BPNN was the lowest, only 16.14ms. Therefore, PSO-BPNN had the best time delay performance in dealing with GBC security risk coupling under different complexities. Figure 11 shows the effect of applying the GBC security risk coupling method.
In Figure 11a, multiple risk management methods showed superior risk control in enhancing construction safety metrics. The performance of risk prevention measures, FTA, ETA, and PSO-BPNN risk coupling analysis methods in the control level of construction safety increased to 92.57%, 82.66%, 70.21%, and 96.38%, respectively. In Figure 11b, different management methods demonstrated improved outcomes in environmental health metrics of the construction environment. Under the risk prevention measures, FTA, ETA, and PSO-BPNN risk coupling analysis methods, the construction environment health indicators improved to 26.32%, 25.47%, 24.15%, and 26.58%, respectively. Therefore, the use of PSO-BPNN in risk coupling analysis significantly enhanced construction safety oversight and environmental health status, thereby effectively enhancing the overall performance of GBC's safety risk management. Figure 12 shows the practicality evaluation of the GBC security risk coupling method.
In Figure 12a, the practical evaluation indices for resource allocation efficiency, operational convenience, risk control effectiveness, and execution acceptance rate of construction implementation were 83.57, 97.31, 88.46, and 91.27, respectively. Therefore, the application performance on the construction site was good, especially in terms of operational convenience, and was favourably rated. In Figure 12b, the evaluation indices for resource allocation efficiency, operational convenience, risk control effectiveness, and execution acceptance rate in construction implementation using the optimized risk coupling analysis method were 93.14, 96.82, 91.55, and 92.87, respectively. Therefore, after optimizing BPNN with PSO, this method significantly improved the acceptance of the construction team, the ease of operation, and the efficiency of resource utilization. The current GBC safety risk management methods were compared based on evaluation indicators for construction safety satisfaction, risk management effectiveness, and construction efficiency. Higher scores indicate superior methodological performance in Table 3.
In Table 3, PSO-BPNN was used to evaluate the three key indicators of construction safety satisfaction, risk management effectiveness, and construction efficiency. After using PSO-BPNN, the construction safety satisfaction increased from 92.14% in the risk assessment matrix, 78.67% in Fault Tree Analysis (FTA), and 83.49% in Event Tree Analysis (ETA) to 98.05%. Similarly, the rating of risk management effectiveness increased from 91.88% in the risk assessment matrix, 81.34% in FTA, and 86.72% in ETA to 97.41%. In terms of construction efficiency, the score after using PSO-BPNN was 98.68%, compared to 87.98% of the risk assessment matrix in the unused state, 76.84% of FTA, and 85.33% of ETA. Therefore, PSO-BPNN had significant effects in improving construction safety, managing risks, and enhancing efficiency, while also having certain effectiveness in dealing with GBC risks. This optimized system more effectively evaluated and managed risks, contributing to improved overall safety and operational efficiency of the construction process.
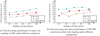 |
Fig. 10 Reliability test results of BPNN for coupling analysis of safety risks in green building construction. |
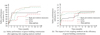 |
Fig. 11 The effect of applying the coupling method of safety risks in green building construction. |
 |
Fig. 12 Practical evaluation of coupling methods for safety risks in green building construction. |
Construction safety satisfaction evaluation form.
4 Discussion
This paper proposes a PSO-BPNN model to enhance the ability to deal with complex construction risks. The satisfaction of construction safety and risk management index effectiveness of PSO-BPNN reached 98.05% and 97.41%, respectively. The main reason is that PSO can quickly search the parameter space and optimize the weight and bias of BP, thereby improving the performance and generalization ability of the model. Compared with the research of H. D. Nguyen and L. Macchion, the PSO-BPNN method has advantages in terms of risk treatment time delay. Taking 100 risk factors as an example, the risk processing delay of PSO-BPNN was only 23.04ms, while the corresponding processing delay in H. D. Nguyen and L. Macchion's study was 37.85ms [28]. In addition, compared with H. Wang's study, PSO-BPNN showed the best delay performance when processing construction safety risk coupling under different complexity conditions. When the risk factor was 48, the processing time delay of PSO-BPNN was only 16.14ms, while similar data was not mentioned in H. Wang's study [29]. These data support the advantages of this research method in improving the efficiency and accuracy of risk management . Compared with H. Yan et al. 's [30] and A. M. Usman et al.' s [31] studies, the PSO-BPNN method in this study has better performance in terms of construction safety satisfaction, risk management effectiveness and construction efficiency.. However, there are some limitations to this study. This study focuses on the field of construction, and its applicability to other industries has not been fully explored. Future studies can apply the method to a wider range of fields to verify its validity and reliability in different industries. In conclusion, the risk management method proposed in this study can effectively identify and manage complex construction risks, and holds strong potential for practical application.
5 Conclusion
GBC urgently needs to address the dual challenges of safety and environmental protection. In response to these challenges, the study adopted PSO-BPNN for coupling analysis of construction process risks, aimed at improving risk control precision and environmental health performance. These studies confirmed that risk control was significantly improved, with construction safety controls for risk prevention measures, FTA, and ETA reaching 92.57%, 82.66%, and 70.21%, respectively. After integrating PSO-BPNN, this level further increased to 96.38%. The environmental health indicators also improved, increasing to 26.32 to 26.58. In addition, the resource allocation efficiency, operational convenience, risk control effectiveness, and execution acceptance rate indicated that the optimized risk coupling analysis method performed robustly under real-world construction conditions. The evaluation of operational convenience was 97.31%. The evaluation scores for all indicators of this optimisation method were above 93.14%. The construction safety satisfaction, risk management effectiveness, and construction efficiency indicators of PSO-BPNN were the highest. After PSO-BPNN optimisation, the satisfaction of construction safety and the effectiveness of risk management indicators reached 98.05% and 97.41%, respectively. The construction efficiency was also improved to 98.68%. Therefore, PSO-BPNN is not only suitable for traditional construction projects, but also exhibits special applicability for large-scale complex construction projects such as infrastructure engineering and large commercial buildings. This type of project involves multiple risk factors, and the coupling relationship between risks is complex. This method can more accurately identify and manage these risks. In addition, in the fields of green and smart buildings, this method further improves construction safety and efficiency by better handling multidimensional risks such as environmental protection, material management, and personnel safety, providing technical support. Therefore, the PSO-BPNN method has broad application potential in these different types of construction projects. However, the applicability and accuracy of PSO-BPNN in different construction environments still warrants further validation. Further research can be conducted on the adaptability improvement and further calibration of model accuracy to ensure its applicability in more construction projects.
Funding
This research received no external funding.
Conflicts of Interest
Both authors declare that there's no conflict of interest.
Data availability statement
All data generated or analyzed during this study are included in this article.
Author contribution statement
LG Wang and SH Li provided the concept and wrote the manuscript; L Wang and Z Zhang analyzed the data and revised the manuscript; YC Zhou and L Chang validate the results; All authors reviewed the manuscript and approved this submission.
References
- Y.P. Choi, H. Ju, D. Koo, Convergence analysis of Particle Swarm Optimisation in one dimension, Appl. Math. Lett. 137, 2–9 (2023) [Google Scholar]
- C. Pan, Z. Jia, J. Huang, Z. Chen, J. Wang, Optimisation of cooling strategy for lithium battery pack based on orthogonal test and particle swarm algorithm, J. Energy Eng. 149, 2–14 (2023) [Google Scholar]
- Y. Xu, C. Hu, Q. Wu, S. Jian, Z. Li, Y. Chen et al., Research on particle swarm optimisation in LSTM neural networks for rainfall-runoff simulation, J. Hydrol. 608, 2–11 (2022) [Google Scholar]
- L. Liu, Y. Zhai, Application of lightweight thermal insulation building materials for green building design, J. Chem. 22, 2–7 (2022) [Google Scholar]
- S. Ferrari, M. Zoghi, T. Blázquez et al., New Level(s) framework: Assessing the affinity between the main international Green Building Rating Systems and the European scheme, Renew. Sustain. Energy Rev. 155 (2022) [Google Scholar]
- J. Jiao, J. Cheng, Y. Liu, H. Yang, D. Tan, P. Cheng et al., Inversion of TEM measurement data via a quantum particle swarm optimisation algorithm with the elite opposition-based learning strategy, Comput. Geosci. 174, 2–13 (2023) [Google Scholar]
- H. Wang, H. He, T. Yang, P. Li, Y. Xiong, P. Wang et al., Indoor high-accuracy multi-dimensional visible light positioning method with adaptive particle swarm optimisation algorithm, Opt. Eng. 62, 2–15 (2023) [Google Scholar]
- S. Huan, A novel interval decomposition correlation particle swarm optimisation-extreme learning machine model for short-term and long-term water quality prediction, J. Hydrol. 625, 2–30 (2023) [Google Scholar]
- T. Liu, Y. Zhang, F. Yang, Fractional order total variational infrared image denoising with fused flower pollination particle swarm optimisation, Opt. Eng. 62, 2–16 (2023) [Google Scholar]
- Y. Luo, X. Du, Y. Cui, Y. Guo, J. Xie, J. Liu, Inversion of self-potential source based on particle swarm optimisation, Geophys. Prospect. 72, 322–335 (2023) [CrossRef] [Google Scholar]
- M. Mavroulidis, P. Vouros, S. Fotiadis, F. Konstankopoulou, G. Fountoulakis, I. Nikolaou et al., Occupational health and safety of multinational construction companies through evaluation of corporate social responsibility reports, J. Safety Res. 81, 45–54 (2022) [CrossRef] [Google Scholar]
- E.D.O. Erkal, M.R. Hallowell, S. Bhandari, Formal evaluation of construction safety performance metrics and a case for a balanced approach, J. Safety Res. 85, 380–390 (2023) [CrossRef] [Google Scholar]
- Z. Zhang, T. Xiang, H. Guo, L. Ma, Z. Guan, Y. Fang et al., Impact of physical and mental fatigue on construction workers' unsafe behavior based on physiological measurement, J. Safety Res. 85, 457–468 (2023) [CrossRef] [Google Scholar]
- J. Guerreiro, J.G. Ferreira, L. Guerreiro, R. Moura, S. Hosseini, The design of a structural hyper-resisting element for life-threatening earthquake risk (SHELTER) for building collapse scenarios: The life-saving capsule, Eng. Struct. 258, 2–20 (2022) [Google Scholar]
- S. Durdyev, S. Tokbolat, H. Sadeghi, T. Zayed, S.R. Mohandes, Examining the OHS of green building construction projects: A hybrid fuzzy-based approach, J. Clean. Prod. 338, 2–12 (2022) [Google Scholar]
- Y. Zhang, H. Yu, H. Zhang, X. Tang, Bread staling prediction with a multiobjective particle swarm optimisation-based bread constitutive modeling method, J. Text. Stud. 54, 498–509 (2023) [CrossRef] [Google Scholar]
- Y. Lin, Q. Zhang, A multi-objective cooperative particle swarm optimisation based on hybrid dimensions for ship pipe route design, Ocean Eng. 280, 2–15 (2023) [Google Scholar]
- Z. Le, X. Song, X. Zhang, C. Shen, X. Shi, Y. Wang et al., Multi-objective particle swarm optimisation for Rayleigh wave full waveform inversion, J. Appl. Geophys. 215, 2–5 (2023) [Google Scholar]
- Z. Kabiri, B. Barekatain, A. Avokh, GOP-SDN: An enhanced load balancing method based on genetic and optimized particle swarm optimisation algorithm in distributed SDNs, Wirel. Netw. 28, 2533–2552 (2022) [CrossRef] [Google Scholar]
- C.L. Tsai, G. Fredrickson, Using particle swarm optimisation and self-consistent field theory to discover globally stable morphologies of block copolymers, Macromolecules 55, 5249–5262 (2022) [CrossRef] [Google Scholar]
- L. Li, L. Xue, X. Chen, D. Yuan, Partial transmit sequence based on discrete particle swarm optimisation with threshold about PAPR reduction in FBMC/OQAM system, IET Commun. 16, 142–150 (2022) [CrossRef] [Google Scholar]
- M.M. Islam, S.A. Siffat, I. Ahmad, M. Liaquat, Supertwisting and terminal sliding mode control of course keeping for ships by using particle swarm optimisation, Ocean Eng. 266, 2–13 (2022) [Google Scholar]
- T.M. Evans, D. Mccallen, H. Tang, S.W. Eckert, E. Huang et al., Coupling of regional geophysics and local soil-structure models in the EQSIM fault-to-structure earthquake simulation framework, Int. J. High Perform. Comput. Appl. 36, 78–92 (2022) [CrossRef] [Google Scholar]
- S. Dong, B. Zhou, T. Zang, X. Xiao, Vulnerability assessment of electrical and thermal cyber physical system considering dual coupling characteristics, IET Gener. Transm. Distrib. 16, 4215–4229 (2022) [CrossRef] [Google Scholar]
- I. Iervolino, Risk-targeted seismic design: Prospects, applications, and open issues, for the next generation of building codes, Earthq. Eng. Struct. Dyn. 51, 1319–1320 (2022) [CrossRef] [Google Scholar]
- Z.A. Ismail, Implementation of BIM-based model checking technology for managing maintenance planning in green building ecosystem, Open House Int. 47, 571–592 (2022) [CrossRef] [Google Scholar]
- G. Liu, T. Zhao, H. Yan, H. Wu, F. Wang, Evaluation of urban green building design schemes to achieve sustainability based on the projection pursuit model optimized by the atomic orbital search, Sustainability 14, 2–23 (2022) [Google Scholar]
- H.D. Nguyen, L. Macchion, Exploring critical risk factors for green building projects in developing countries: The case of Vietnam, J. Clean. Prod. 381, 2–14 (2022) [Google Scholar]
- H. Wang, Ecological village planning and green building design from the perspective of rural environmental aesthetics, Sci. Program. 22, 2–9 (2022) [Google Scholar]
- H. Yan, Z. Fan, Y. Zhang, L. Zhang, Z. Hao, A city-level analysis of the spatial distribution differences of green buildings and the economic forces − A case study in China, J. Clean. Prod. 371, 2–13 (2022) [Google Scholar]
- A.M. Usman, M.K. Abdullah, An assessment of building energy consumption characteristics using analytical energy and carbon footprint assessment model, Green Low-Carbon Econ. 1, 28–40 (2023) [CrossRef] [Google Scholar]
Cite this article as: L. Wang, S. Li, L. Wang, Z. Zhang, Y. Zhou and L. Chang: Coupling of green building construction based on particle swarm optimizing neural network algorithm. Sust. Build. 8, 1 (2025). https://doi.org/10.1051/sbuild/2025001
All Tables
All Figures
|
Fig. 1 Structure of the BPNN model. |
| In the text | |
|
Fig. 2 Process of BPNN. |
| In the text | |
|
Fig. 3 PSO algorithm process. |
| In the text | |
|
Fig. 4 Process of PSO-optimised BPNN. |
| In the text | |
|
Fig. 5 Coupling relationships among human, material, environmental, and management risks in green building construction. |
| In the text | |
|
Fig. 6 Safety risk coupling framework based on PSO-optimised BPNN. |
| In the text | |
|
Fig. 7 Comparison of predicted and actual values of BPNN and PSO-BPNN. |
| In the text | |
|
Fig. 8 Comparison results of network errors between BPNN and PSO-BPNN. |
| In the text | |
|
Fig. 9 Regression results of PSO-BPNN. |
| In the text | |
|
Fig. 10 Reliability test results of BPNN for coupling analysis of safety risks in green building construction. |
| In the text | |
|
Fig. 11 The effect of applying the coupling method of safety risks in green building construction. |
| In the text | |
|
Fig. 12 Practical evaluation of coupling methods for safety risks in green building construction. |
| In the text | |
Current usage metrics show cumulative count of Article Views (full-text article views including HTML views, PDF and ePub downloads, according to the available data) and Abstracts Views on Vision4Press platform.
Data correspond to usage on the plateform after 2015. The current usage metrics is available 48-96 hours after online publication and is updated daily on week days.
Initial download of the metrics may take a while.