


| Issue |
Sust. Build.
Volume 9, 2026
|
|
|---|---|---|
| Article Number | 4 | |
| Number of page(s) | 13 | |
| Section | Modelling and Optimisation of Building Performance | |
| DOI | https://doi.org/10.1051/sbuild/2026001 | |
| Published online | 10 June 2026 | |
Original Article
Three-dimensional modeling method of large football stadium frame structures based on trinocular stereo vision and ABAQUS
CCCC Third Highway Engineer Co., Ltd, Beijing 101300, PR China
* e-mail: This email address is being protected from spambots. You need JavaScript enabled to view it.
Received:
27
May
2025
Accepted:
2
April
2026
Abstract
To realize multiphysics field coupling analysis of large football stadium frame structures, a three-dimensional modeling method based on trinocular stereo vision and ABAQUS is proposed. This method acquires positional data of the frame structure, calibrates the three-camera plane for trinocular stereo measurement, and constructs a trinocular stereo vision model. Using this model, positional data of the large football stadium frame structure are obtained. Three-dimensional modeling is then completed in ABAQUS through the steps of part creation, assembly, material property definition, and meshing. Taking a large football stadium as the experimental subject, 10 sets of experiments are conducted. Camera calibration in the trinocular stereo measurement process serves as the basis for measuring the stadium frame structure. Different measurement distances, various lighting conditions, and diverse load conditions are set. The results demonstrate that the proposed method effectively accomplishes three-camera calibration for trinocular stereo measurement and obtains nonlinear analysis results such as displacement and horizontal tensile stress, showing favorable application performance.
Key words: Trinocular stereo measurement / ABAQUS / large football stadium / frame structure / three-dimensional modeling
© C. Wang, Published by EDP Sciences, 2026
 This is an Open Access article distributed under the terms of the Creative Commons Attribution License (https://creativecommons.org/licenses/by/4.0), which permits unrestricted use, distribution, and reproduction in any medium, provided the original work is properly cited.
1 Introduction
Three-dimensional modeling of large football stadium frame structures constitutes a key technology in modern construction engineering. It provides designers with intuitive visualization tools and establishes a digital foundation for subsequent structural safety analyses, construction process simulations, and stadium operation management [1]. With the advancement of building information modeling technology, three-dimensional modeling has emerged as a core method for designing and managing complex building structures [2,3]. As a type of public building with complex functions and large spans, the frame structure of a large football stadium typically comprises foundations, stands, roof systems, and supporting structures [4].
Currently, numerous scholars have investigated three-dimensional modeling methods for frame structures. For instance, Cannizzaro et al. [5] proposed a discrete modeling approach for externally bonded composite layers on masonry structures. This method simplified the masonry structure and the composite layer, employing ANSYS to construct the initial masonry model, assigning parameters such as elastic modulus and Poisson's ratio to different parts, applying boundary conditions and loads, and finally using a solver to perform numerical calculations on the loading behavior of the masonry structure and composite layer. In frame structures, components such as beams and columns were primarily composed of reinforced concrete, which exhibited significantly different mechanical properties from masonry. Merely incorporating conventional parameters like elastic modulus and Poisson's ratio could not comprehensively or accurately capture the complex mechanical behavior arising from steel-concrete interaction, leading to inaccuracies in simulation results when using this approach for three-dimensional frame structure models. Bucher et al. [6] introduced a performance-based deep conditional generative model for parametric modeling of engineering structures. This method inputs structural parameters into MIDAS Gen software and achieves parametric modeling through meshing and constraint definition. Although MIDAS Gen offered powerful capabilities, its internal algorithms were designed for general building structures. For frame structures with unique mechanical response characteristics, these algorithms may not be fully compatible, exhibiting limitations in addressing issues such as internal force redistribution and deformation coordination. Hunter et al. [7] proposed a three-dimensional brick-and-mortar modeling method based on the cohesive zone finite element method. This approach used advanced cohesive zone finite element techniques to thoroughly account for the complex interfacial behavior between bricks and mortar, enabling precise modeling of three-dimensional brick-mortar structures. By carefully defining parameters such as material mechanical properties and cohesive interface constitutive relationships, it could effectively simulate structural mechanical responses under various loading conditions. Frame structures, however, exhibited distinct load transfer paths and deformation modes under horizontal and vertical loads—such as lateral displacement and internal force redistribution under lateral loads. Since the stress mechanisms in brick-and-mortar structures differed from those in frame structures, models based on the former could not accurately simulate the mechanical responses of frame structures under different loading conditions, resulting in discrepancies between calculated results and actual behavior. Shayanfar et al. [8] proposed a method for developing a stress–strain model that described the structural softening behavior of FRP-confined circular concrete columns. This method used the general finite element software ABAQUS to build a detailed three-dimensional model of FRP-confined circular concrete columns and applied a piecewise function to divide the stress process into elastic, hardening, and softening stages, establishing corresponding stress–strain relationships for each stage. For the softening stage, the confining effect of FRP on concrete and the accumulation of internal damage in concrete were incorporated through a damage evolution equation to accurately describe stress variation with strain. To build the model of FRP-confined circular concrete columns, the structure was simplified by focusing on the compressive behavior of FRP and concrete. However, frame structures comprised various components and complex construction details, such as bending and shear in frame beams and eccentric compression in columns. This simplified model could not encompass all key mechanical characteristics of frame structures, thus failing to accurately represent the true mechanical performance in a three-dimensional frame structure model.
Although the method of combining stereo vision with finite element analysis has been applied in structural modeling research—such as in three-dimensional reconstruction and mechanical analysis of industrial parts, bridges, or simple building components—there remains a gap in deeply integrating high-precision trinocular stereo measurement technology with ABAQUS' advanced nonlinear analysis capabilities to conduct integrated, full-process modeling research, ranging from high-precision geometric data acquisition to refined multiphysics mechanical response analysis, for complex frame structures of large football stadiums. Existing methods often exhibit shortcomings in geometric measurement accuracy and efficiency, accurate characterization of complex materials, or collaborative simulation of global and local structural mechanical behavior, making it difficult to meet the modeling requirements for large-span, multi-component structures with strongly nonlinear characteristics such as large football stadiums.
Trinocular stereo measurement is a computer vision-based three-dimensional reconstruction technique that employs three cameras to simultaneously capture a target object from different angles and calculates the three-dimensional coordinates of the object using the principle of triangulation. This method effectively improves measurement accuracy and robustness, making it suitable for three-dimensional modeling, object detection, and motion analysis in complex scenarios [9]. Trinocular stereo measurement technology finds broad applications in industrial inspection, robot navigation, virtual reality, and other fields, with its core functions encompassing camera calibration, image matching, and optimization of three-dimensional reconstruction algorithms. ABAQUS is a powerful finite element analysis software widely utilized in structural mechanics, heat conduction, fluid dynamics, and multiphysics coupling analysis in engineering. It offers a comprehensive range of material models, element types, and solvers, enabling the simulation of diverse engineering scenarios from simple linear problems to complex nonlinear problems. ABAQUS holds a significant position in aerospace, automotive, civil engineering, and biomedical fields, where its high-precision computing and visualization capabilities provide reliable tool support for engineering design, optimization, and failure analysis [10].
In view of the aforementioned research gaps, this paper proposes a three-dimensional modeling method for large football stadium frame structures based on trinocular stereo vision and ABAQUS. This method acquires the spatial geometric information of a complex large football stadium frame structure with high precision and in a non-contact manner, ensuring the reliability of the measured data through camera calibration and model construction. The accurate geometric data are seamlessly imported into the ABAQUS environment, and a three-dimensional finite element model that accurately reflects the actual mechanical behavior of the structure is constructed by creating refined components, defining advanced material models such as concrete damage plasticity, performing meshing, and setting boundary conditions. Finally, nonlinear responses such as stress, strain, and displacement of this type of structure under various load conditions and environmental effects are effectively simulated, thereby addressing the deficiencies of existing methods in high-fidelity integrated modeling and analysis for this specific complex structure of large football stadiums.
2 Three-dimensional modeling of large football stadium frame structures
2.1 Measurement of large football stadium frame structures based on trinocular stereo vision
2.1.1 Calibration of trinocular stereo vision system
The purpose of calibrating the three cameras in trinocular stereo measurement is to precisely determine their internal parameters—such as focal length, principal point coordinates, and distortion coefficients—along with external parameters such as relative positions and orientations. This establishes an accurate geometric relationship among the cameras, enabling precise reconstruction and measurement of three-dimensional spatial points. The calibration process corrects intrinsic camera distortion errors, ensures collaborative operation of the three cameras in measuring the frame structure of a large football stadium, enhances the accuracy and reliability of the stereo measurement, and provides a solid foundation for subsequent three-dimensional reconstruction, target positioning, and spatial analysis of the stadium frame structure.
The coplanarity condition equation describes the geometric relationship in which the photographic baseline of a stereo image pair and the two corresponding image rays must lie in the same plane. This represents another fundamental analytical relationship in close-range photogrammetry. As shown in Figure 1, the image space coordinate system S1—xyz of image 1—is selected as the photogrammetric coordinate system for the large football stadium frame structure. Let the projection center S2 have coordinates  in the S2—xyz system. Vectors
  and
and  are coplanar, and the coplanarity condition equation can be used to directly establish a geometric model analogous to the large football stadium frame structure. Based on this principle, the relative orientations of multiple photographs can be determined.
The three-camera calibration technique based on the coplanarity condition utilizes the coplanarity condition equation from close-range photogrammetry to determine the relative orientation of multiple photographs without requiring control points. Subsequently, by measuring a known distance, the absolute orientation is achieved, thereby completing the calibration of the trinocular stereophotogrammetric system.
The coplanarity equation can be expressed in matrix coordinate form as:
 (1)
(1)
 (2)
(2)
In Equations (1) and (2),  represent the image–space coordinates of the left photograph;
  denote the image–space coordinates of the right photograph;
  ,
,  are the components of the photographic baseline; μ is the rotation matrix; and p, q, and r are parameters in the matrix coordinate representation of the coplanarity condition equation, which depend on the coordinates of the image point in the image space coordinate system.
The unit quaternion for trinocular measurement satisfies the condition  , leading to the following expression:
 (3)
(3)
Let  represent the independent parameters of the three camera measurement planes during trinocular measurement. The quaternions
  ,
,  during the trinocular measurement process are obtained as:
 (4)
(4)
In Equation (4), V represents the camera motion parameter matrix in the trinocular measurement system.
Using Equation (4), the independent parameters of the three-camera measurement planes during the measurement of the frame structure of a large football stadium are obtained, and these parameters are subsequently used to calibrate the three camera planes.
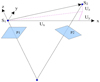 |
Fig. 1 Schematic of the coplanarity condition. |
2.1.2 Construction of the trinocular stereo vision model
A trinocular stereo vision model is developed, as shown in Figure 2.
The optical centers of the left, middle, and right cameras in the model are denoted as Cl, Cm, and Cr, respectively, while the optical axes of the three cameras are represented by dashed lines intersecting at point O. The baseline distance between two adjacent cameras is A, the angle between their optical axes is α, and the arc radius of the model is R. Based on this geometric configuration, the following equation can be derived:
 (5)
(5)
As shown in Figure 2, if A is fixed, varying R or α generates trinocular stereo models with different curvatures. When the radius R approaches infinity and α approaches 0° , the resulting trinocular stereo model becomes an idealized configuration, with optical centers aligned collinearly and optical axes parallel. If A is variable, all corresponding baseline distances A follow the aforementioned relationship. Thus, this trinocular stereo model encompasses both conventional symmetrical forms and idealized characteristics.
Given identical camera dimensions, lens focal lengths, and measurement distances, the trinocular model exhibits the same vertical measurement range as a single camera; thus, the analysis focuses primarily on its horizontal measurement range. Assuming the cameras in the trinocular model are identical [11], with the middle camera position fixed such that its optical axis coincides with the z-axis and the horizontal field of view is 2D, the trinocular model can be categorized into two types based on the value of α: if α = 0°, the model corresponds to an idealized configuration; if 0° < α < 90°, it represents a conventional optical-axis intersection model, as illustrated in Figure 3.
In both models, regions I, II, and III represent the effective fields of view, indicating that at least two cameras overlap in these areas, where  denotes the minimum measurement length. In Figure 3,
  corresponds to the maximum measurement length, and region L refers to the blind zone formed when exceeding
  . The horizontal common field of view of the three-camera model is denoted as I, primarily determined by the overlap range of the two side cameras [12]. The following equations provide the calculation formulas for
  under different conditions, where
  represents the baseline distance between two cameras.
Let E be an arbitrary point measured within the trinocular stereo model with intersecting optical axes, with its coordinates in the fields of view of the three cameras given by  ,
,  , and
, and  , indicating that the spatial coordinate expression of this point in reality is
 (6)
(6)
In Equation (6),  is a matrix constructed from the image coordinates
  of the three cameras and the camera projection relationships, and U is the vector to be solved, which represents the spatial coordinates of point E in reality. In actual computation, singular value decomposition of
  yields the spatial coordinates of point E, thereby providing the trinocular stereo measurement values for the large football stadium frame structure.
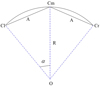 |
Fig. 2 Trinocular stereo vision model. |
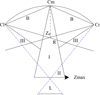 |
Fig. 3 Conventional optical axis intersection model. |
2.2 Three-dimensional modeling of large football stadium frame structures based on ABAQUS
ABAQUS, developed by Dassault Systèmes, is a powerful general-purpose finite element analysis software widely employed in various engineering fields for simulating complex physical phenomena and engineering problems, thereby providing a reliable basis for product design, performance evaluation, and optimization. Based on the spatial positional data of the large football stadium frame structure obtained through trinocular stereoscopic measurement in Section 2.1, a three-dimensional model is constructed using ABAQUS. The detailed implementation process is as follows.
Step 1: Information Collection. Design drawings of the frame structure, including architectural and structural layouts, are collected to determine the dimensions, shapes, and connection methods of each component. The spatial positional data are acquired through the measurement described in Section 2.1.
Step 2: Part Creation. The ABAQUS software is launched, and the “Part” module is selected from the main interface to access the part creation environment, which provides various tools for generating parts of different shapes [13]. The “Create Part” icon is clicked to open the dialog box. The part is named (e.g., “Column-1” for the first column) for subsequent identification and management. The “3D” option is chosen to create a three-dimensional part, with “Solid” selected as the type and “Extrusion” as the base shape. After configuring the parameters, “Continue” is clicked to enter the sketching interface. Drawing tools from the left toolbar are used to sketch the cross-sectional shape. For instance, the “Rectangle” tool is employed to draw a rectangular beam cross-section by specifying diagonal points and entering length and width dimensions; alternatively, the “Circle” tool is used to draw a circular column cross-section by defining the center point and radius. The “Constraints” tool is applied to ensure geometric accuracy. After completing the sketch, “Done” is clicked to return to the main interface. In the “Create Extrusion” dialog, the extrusion length is entered based on actual dimensions, and “OK” is clicked to extrude the two-dimensional sketch into a three-dimensional solid part.
Step 3: Part Assembly. The beams, columns, and other parts created in the previous step are imported into the assembly module. Operations such as translation and rotation are performed to position the parts accurately, replicating the relative spatial relationships of the actual frame structure [14]. Binding constraints are applied at connection points to simulate realistic joints.
Step 4: Material Property Definition. Material properties of the frame structure are defined according to the actual materials used, such as concrete and steel. Suitable material models are selected from the ABAQUS material library, and mechanical parameters including elastic modulus, Poisson's ratio, density, and yield strength are input [15]. For concrete, compressive strength, tensile strength, and other relevant parameters are specified.
Step 5: Meshing. The “Mesh” module is accessed from the ABAQUS main interface after part creation, assembly, and material definition. The component or assembly to be meshed is selected from the model tree. For complex frame structures [16], individual key components are meshed first, followed by adjustments to the overall assembly to optimize mesh quality and computational efficiency. For tetrahedral meshing, the “Seeds” tool is activated, and the “Global” tab is used to set an appropriate global seed size. The “Mesh” tool is then employed, with the “Tetrahedron” mesh type selected in the “Mesh Controls” dialog, and the mesh size is defined to complete the meshing process.
Step 6: Boundary Condition Creation. The “Create Boundary Condition” icon is clicked to open the corresponding dialog. The boundary condition is named (e.g., “Fixed-Support” for a fixed support condition) to facilitate identification and management [17]. The relevant analysis step is selected, typically the initial step, to ensure consistency throughout the analysis.
The concrete damage plasticity model in ABAQUS, based on the model proposed by Lubliner, Lee, and Fenves, provides a general material model for analyzing the mechanical response of large football stadium frame structures under cyclic and dynamic loading conditions [18]. It accounts for the differences in tensile and compressive material properties and is primarily used to simulate irreversible material degradation caused by damage under low confining pressures. The model incorporates a damage index into the concrete formulation, reducing the elastic stiffness matrix to simulate the decrease in unloading stiffness with progressive damage, making it suitable for nonlinear analysis of reinforced concrete structures. The fundamental aspects of this study are as follows:
(1) Strain rate decomposition:
The total strain rate in the large football stadium frame structure is decomposed into elastic and plastic components, expressed as:
 (7)
(7)
In Equation (7),  denotes the total strain rate of the large football stadium frame structure,
  represents the elastic component of the strain rate, and
  corresponds to the plastic component of the strain rate.
(2) Stress–strain relationship:
The stress–strain relationship of the large football stadium frame structure follows an elastic scalar damage model:
 (8)
(8)
In Equation (8),  denotes the initial undamaged stiffness of the material,
  represents the damaged stiffness, and
  is the stiffness damage variable, which ranges from 0 (undamaged) to 1 (fully damaged).
(3) Yield function:
The yield function  of the large football stadium frame structure defines a spatial surface in the effective stress space, determining the state of failure or damage [19], and is expressed as follows:
 (9)
(9)
In Equation (9), b is a dimensionless material constant,  is the von Mises equivalent stress,
  is the effective hydrostatic pressure, and
  is the effective tensile-compressive cohesion.
(4) Flow rule:
A non-associated flow rule is adopted in this model. According to the flow rule [20,21], the plastic flow of the large football stadium frame structure is governed by the plastic potential G, which takes the form of the Drucker–Prager hyperbolic function.
 (10)
(10)
In Equation (10),  denotes the dilation angle,
  represents the eccentricity of the plastic potential function governing its asymptotic approach rate, and
  corresponds to the uniaxial tensile strength [22,23].
Through the above formulations, nonlinear analysis results of the large football stadium frame structure were obtained. The three-dimensional modeling flow chart of the large football stadium frame structure is shown in Figure 4.
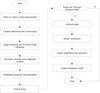 |
Fig. 4 Flowchart of three‑dimensional modeling for large football stadium frame structures. |
3 Experimental analysis
The experimental and verification work of this study is based on a completed large football stadium. The stadium has a total construction area of 194,000 square meters. The main structure is a cast-in-place reinforced concrete frame-supporting system, and a typical structural unit in the middle stand on the west side is selected as the experimental focus. The unit is approximately 45 m in length, 25 m in width, and between 8 and 22 m in height, comprising four main frames along with corresponding beams, columns, and grandstand components. To simulate the actual stress state, a sandbag stacking load with a total weight of 800 kN is applied as an equivalent static load over an area of about 200 m on the stand. Simultaneously, displacement-controlled low-cycle reciprocating horizontal loading is applied at the foot of the bottom column using hydraulic actuators, with the loading amplitude gradually increased from 5 to 50 mm to investigate the nonlinear dynamic response of the structure. During the construction of this case project, a technical route combining traditional measurement methods with finite element analysis is adopted, and its structural form is similar to the research object of this paper. During the experiment, 20 resistance strain gauges and 8 displacement meters are installed at key locations such as the column base and beam ends to monitor local responses, while the full three-dimensional displacement field of the structure is synchronously obtained using the trinocular stereo measurement system. The material parameters used for modeling are determined through on-site coring and sampling tests. The average compressive strength of concrete is 45.2 MPa, and the yield strength of steel reinforcement is 435 MPa. Model verification is performed through multi-level data comparison. By comparing the three-dimensional point cloud reconstructed by the trinocular system with the coordinates of 85 characteristic control points independently collected by a total station, the average point error is 12.3 mm, confirming the accuracy of geometric data acquisition. In terms of static verification, the measured stress values from strain gauges under equivalent stacked load show good agreement with the simulation results from the ABAQUS model, with an average relative error of 4.8% across five key measurement points. For dynamic verification, the relative errors between the measured load-displacement hysteretic curve and the simulated curve are less than 5% in key indicators such as peak load, cumulative energy dissipation, and stiffness degradation, and the overall displacement pattern is consistent with modal analysis results. Parametric analysis based on the validated model indicates that the model can reasonably predict the degradation trend of the overall structural performance under different concrete carbonation depths. During the experiment, ten tests are conducted. The camera model used for three-dimensional measurement is the MV-EM500/MC, and its detailed parameters are provided in Table 1.
Camera calibration during the three-dimensional measurement process constitutes the basis for measuring the frame structure of a large football stadium. Different measurement distances are set, and a target point is used as the experimental subject to validate the camera calibration capability of the proposed method in three-dimensional measurement. The test results are summarized in Table 2.
According to Table 2, the measurement error of this method ranges from 0.01 to 0.046 m across all tested distances, indicating high consistency between measured and actual distances and demonstrating high measurement accuracy. Although the error at 9 and 12 m is relatively large, it decreases rapidly at longer distances, suggesting stable accuracy in long-range measurements. These results confirm the excellent reliability and stability of the trinocular stereo measurement method in camera calibration, effectively resisting interference from varying distances and ensuring measurement precision.
To test the real-world structure, a stand in the large football stadium is taken as the experimental object. This method uses the trinocular stereo measurement technique to obtain the positional data of the stand frame structure, and the results are shown in Figure 5.
As shown in Figure 5, the proposed method can effectively acquire the positional data of the large football stadium frame structure using trinocular stereo measurement, providing a basis for subsequent three-dimensional modeling of the structure. Based on the three-dimensional measurement data, this method obtains the positional data of the large football stadium frame structure and subsequently uses ABAQUS to construct a three-dimensional model of the structure, with the result shown in Figure 6.
As shown in Figure 6, the model exhibits high fidelity and accuracy. It fully represents the core components of the stadium: the stand area is clearly defined, and the details of stands and passages at different elevations are well captured, intuitively conveying the spatial layout of a live event. Peripheral frame structures, such as ceilings, are accurately modeled in terms of geometric shape and structural connections, reflecting both the architectural appearance and internal support characteristics.
Using a stand frame structure in this large football stadium as the experimental object, the three-dimensional model constructed by this method is first subjected to static load analysis to simulate the horizontal tensile stress distribution under the design equivalent static load. The results are shown in Figure 7.
As shown in Figure 7, different regions exhibit distinct stress values, with color variations directly reflecting the stress distribution. The red areas indicate high stress levels, reaching +8.24 MPa, which means these components bear significant horizontal tensile stress and may require special attention and reinforcement in structural design. In contrast, the blue areas show low stress values, approximately −5.41 × 10⁻² MPa, suggesting relatively minimal stress concentration. The repeated application of the proposed method demonstrates strong effectiveness, consistently providing stable and accurate representations of the stress distribution in the grandstand frame structure across multiple simulations, thereby offering reliable data support for structural design and optimization.
Using a concrete column from a frame structure in the football stadium as the experimental object, the three-dimensional model is employed in a dynamic load analysis to simulate low-cycle reciprocating loading. The relationship between horizontal displacement and load under quasi-static cyclic horizontal loading is investigated, with the simulation results presented as a hysteretic curve, as shown in Figure 8.
As shown in Figure 8, the hysteresis curves exhibit a full spindle shape, indicating good energy dissipation capacity of the concrete column. With increasing lateral load, the horizontal displacement increases correspondingly, and the envelope area of the curve gradually expands, reflecting continuous energy absorption during loading. The pinching phenomenon of the curve is not pronounced, suggesting relatively slow stiffness degradation under cyclic loading and demonstrating good overall structural integrity and stability. The symmetry of the curves under positive and negative loading also indicates consistent mechanical properties in both directions. The repeated application of the proposed method offers multiple advantages: it can accurately represent the mechanical response of concrete columns under different working conditions, providing a reliable basis for structural design; through repeated simulation comparisons, performance variations at different stages can be understood, enabling timely identification of potential weak areas. These results confirm the effectiveness of the proposed method.
Concrete carbonation originates from chemical reactions and external factors. The hydration of cement produces calcium hydroxide, which reacts with carbon dioxide through concrete pores to form calcium carbonate and water. Several factors may accelerate carbonation, including raw material factors (such as high water-cement ratio, low cement content, and specific admixtures), environmental factors (such as 50%–75% relative humidity and elevated temperatures), and construction factors (such as insufficient mixing, vibration, and improper curing). For large football stadium frame structures, carbonation reduces concrete alkalinity, leading to depassivation and corrosion of steel reinforcement, which compromises structural durability. It also induces concrete shrinkage, causing cracks and reducing overall structural integrity and load-bearing capacity, thereby threatening structural safety and potentially affecting long-term serviceability. Using a frame structure in this large football stadium as the experimental object, the relationship between the base shear force and the vertex displacement of the entire frame structure under horizontal thrust at different concrete carbonation depths is simulated through static nonlinear analysis. The results are shown in Figure 9.
As shown in Figure 9, the base shear force initially increases rapidly with roof displacement, then the growth rate slows and gradually stabilizes. This indicates that during the initial stage of structural deformation, the base shear force increases with displacement, demonstrating the structure's capacity to sustain increasing loads. The structure may enter the plastic deformation stage when the roof displacement reaches a certain level, where the increase in base shear becomes less pronounced. Comparing curves at different carbonation depths, the non-carbonated structure exhibits the lowest curve, while curves for carbonation depths of and appear successively higher. This means that under the same vertex displacement, the deeper the carbonation depth, the greater the bottom shear force that the structure can bear. However, this does not indicate a beneficial effect of carbonation. Carbonation alters concrete mechanical properties, such as the elastic modulus, modifying structural stiffness and consequently changing the base shear-roof displacement relationship. Long-term carbonation reduces concrete alkalinity, leading to depassivation and corrosion of reinforcement, compromising structural durability, inducing concrete shrinkage, causing cracks, and reducing overall integrity and load-bearing capacity. The proposed method demonstrates good performance in practical applications. By simulating the structural response of a large football stadium frame structure under different carbonation depths using the three-dimensional model, changes in mechanical properties under varying carbonation states can be accurately determined, providing reliable support for structural design, construction, and maintenance. Based on simulation results, engineers can optimize structural solutions during design, implement effective protective measures during construction to mitigate carbonation, and evaluate and monitor structural safety during maintenance, thereby ensuring the safety and durability of the large football stadium frame structure and extending its service life.
The equivalent design static load is applied to a specific area of the stand, and the stress response of key components is measured using the installed strain gauges. The measured stress data are compared with the simulated stress results, and the specific data pairs are presented in Table 3.
According to Table 3, under the control condition, the stress distribution trend simulated by the model shows high consistency with the measured results, and the average relative error between simulated and measured stress values in key areas is less than 5%, confirming the effectiveness of the model in static response prediction.
For similar concrete columns, a low‑cycle reciprocating loading test is conducted, and the test curve is compared with the simulation curve. The specific parameters are listed in Table 4.
According to Table 4, the simulated values of initial stiffness, peak load, ultimate displacement, and cumulative energy consumption are 185.3 kN/mm, 856.7 kN, 42.5 mm, and 325.8 kN m, respectively; the experimental values are 193.6 kN/mm, 895.2 kN, 44.1 mm, and 338.9 kN·m, respectively. There are some differences between the simulated and experimental values. The relative errors for initial stiffness, peak load, ultimate displacement, and cumulative energy consumption are 4.29%, 4.30%, 3.63%, and 3.87%, respectively. After optimization, the agreement between simulated and experimental values improves significantly: the relative error of initial stiffness decreases from 4.29% to 1.45%, peak load from 4.30% to 1.10%, ultimate displacement from 3.63% to 0.68%, and cumulative energy consumption from 3.87% to 1.09%. It can be concluded that the simulation method achieves good performance in reproducing the hysteretic characteristics of concrete columns, with results close to experimental data, thus accurately reflecting, to a considerable extent, the actual performance of concrete columns under low‑cycle repeated loading tests.
To verify the accuracy of the proposed trinocular stereo measurement system, it is compared with the methods described in references [5] and [6]. In the same experimental scene, the three methods are used to measure a set of control points with known three‑dimensional coordinates, and their measurement errors are calculated. The experiment includes 12 control points distributed at different distances (3–24 m) and heights to comprehensively evaluate the spatial measurement performance of the systems. The comparative experimental results are given in Table 5.
It can be seen from Table 5 that the average errors measured by the proposed method and the methods in references [5] and [6] differ significantly across measurement distances ranging from 3 m to 24 m. Specifically, the average error of the proposed method is notably smaller than those of references [5] and [6] at each distance point. At 3 m, the average error is reduced to 3.2 mm, compared to 15.8 mm for reference [5] and 11.2 mm for reference [6]. At 24 m, the average error is reduced to 18.6 mm. In terms of global average error, the proposed method achieves 10.5 mm, whereas reference [5] yields 54.2 mm and reference [6] yields 31.8 mm. Therefore, compared with the methods in references [5] and [6], the three‑dimensional modeling method for large football stadium frame structures proposed in this paper demonstrates higher measurement accuracy across different distances and spatial positions.
To systematically evaluate the comprehensive performance of the proposed method, the methods from references [5] and [6] are selected for comparative analysis. Taking a typical stand area of the large football stadium studied in this paper as the test object, the comparison is conducted from three aspects: geometric accuracy, mechanical simulation accuracy, and modeling efficiency. The comparison results are presented in Table 6.
As shown in Table 6, in terms of geometric accuracy, the average point error of the proposed method is 23.5 mm, which is higher than the 12.8 mm of reference [5] but much lower than the 48.9 mm of reference [6]; the point cloud completeness reaches 98.7%, higher than the 90.2% of reference [5] and the 95.3% of reference [6]. In terms of simulation accuracy, the average relative errors for static stress analysis and fundamental frequency calculation with the proposed method are 4.67% and 3.2%, respectively, significantly lower than those of reference [5] (16.82% and 5.1%) and reference [6] (19.45% and 7.8%). In terms of modeling efficiency, the data acquisition time for the proposed method is 2.5 h, the total preprocessing time is 6.0 h, and the total process time is 12.7 h, which are substantially shorter than the corresponding times for reference [5] (7.2, 10.0, and 42.1 h) and reference [6] (8.8, 8.5, and 38.5 h). Overall, the proposed method outperforms the methods in references [5] and [6] in geometric accuracy, mechanical simulation accuracy, and modeling efficiency.
Parameters of the MV-EM500/MC camera.
Camera calibration results.
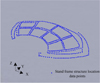 |
Fig. 5 Three-dimensional measurement results of the grandstand frame structure. |
 |
Fig. 6 Three-dimensional model of the large football stadium frame structure. |
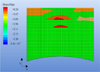 |
Fig. 7 Horizontal tensile stress of the grandstand frame structure. |
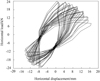 |
Fig. 8 Hysteresis curve of horizontal load versus displacement for concrete columns in the frame structure. |
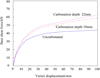 |
Fig. 9 Relationship between base shear and roof displacement in the large football stadium frame structure. |
Comparison of simulated and measured stresses in key components of the grandstand frame structure.
Comparison of simulated and experimental hysteretic characteristics for concrete columns.
Accuracy comparison results of different measurement methods.
Comparison results of comprehensive performance of different three‑dimensional modeling methods.
4 Conclusion
In this paper, a three-dimensional modeling method for large football stadium frame structures using ABAQUS is proposed, and the following conclusions are drawn through the research:
The method achieves high-precision three-dimensional coordinate acquisition of large-scale frame structures, with the system calibration error controlled within 0.05 m over a measurement range of 3–24 m.
By integrating the spatial coordinate data obtained from trinocular stereo measurement with the ABAQUS finite element modeling process, a three-dimensional model that accurately reflects the geometric characteristics of the actual structure is constructed. The model demonstrates good accuracy in terms of component dimensions, spatial positions, and connection relationships.
The nonlinear analysis results based on the concrete damage plasticity model show high consistency with experimental data. The simulation error of structural stress distribution under static load is less than 5%; in terms of dynamic characteristics, the relative error of fundamental frequency calculation is also less than 5%.
Although the three-dimensional modeling method for large-scale football stadium frame structures proposed in this paper demonstrates good accuracy and application performance in experiments, several limitations remain, which should be noted and addressed in future research.
Applicability of trinocular stereo vision in complex environments: Trinocular stereo measurement is sensitive to lighting conditions, target surface texture, and scene occlusion. In field environments with uneven illumination, prominent shadows, or mutual occlusion of structural components, image-matching accuracy may decrease, thereby affecting the quality of three-dimensional coordinate extraction. Future studies may explore the fusion of multi-source sensors (e.g., laser scanning and infrared imaging) or adopt adaptive exposure and feature-enhancement algorithms to improve system robustness under complex working conditions.
Computational efficiency and scalability of model scale: In the finite element analysis stage, using the refined model of the stand frame structure as an example, a static nonlinear analysis takes approximately 50 minutes on the same hardware, with memory usage of about 16 GB; if a dynamic nonlinear analysis under low-cycle reciprocating loading with 50 loading steps is performed, the time increases to about 4.2 h. When the model is extended to the full-field frame structure, the estimated number of elements exceeds 22 million, and performing multiphysics coupling or dynamic time-history analysis would lead to an exponential increase in computational resource demands, posing clear requirements for large-scale parallel computing clusters (a configuration with over 100 CPU cores, terabyte-level memory, and high-speed interconnection is recommended). To address this challenge, future work will investigate GPU-based parallel computing acceleration techniques, model-reduction methods suitable for frame structures, and parametric automated modeling workflows, which would significantly improve the efficiency of large-scale structural modeling and analysis while maintaining accuracy in key regions.
Parameter dependence and integration constraints of ABAQUS in nonlinear material simulation: Within the research context of combining trinocular stereo measurement data with ABAQUS for nonlinear analysis of large football stadium frame structures, the use of ABAQUS itself presents certain constraints in integration and application. These constraints are not limited to the parameter dependence of material constitutive models but extend throughout the entire process from geometric reconstruction to simulation analysis. In terms of geometric compatibility, point-cloud data obtained from binocular vision are characterized by high density and discretization. However, ABAQUS has functional limitations in directly processing such free-form geometry and generating high-quality parametric surfaces suitable for finite element analysis. Usually, third-party geometry-processing software or custom conversion scripts are required for geometry repair and simplification, which may introduce geometric deviations and increase preprocessing complexity. Second, in terms of physical-condition mapping, visual measurement mainly provides spatial shape and static displacement information of the structure, whereas refined boundary conditions and realistic environmental loads necessary for nonlinear analysis are difficult to derive directly from image data and still require additional monitoring, code-based estimation, or engineering experience. Inaccurate definitions can directly affect the reliability of structural nonlinear response prediction. Regarding computational feasibility, maintaining high geometric and mechanical fidelity in a full-structure refined model leads to a large-scale finite element system, which places high demands on memory capacity, multi-core parallel scalability, and computational stability and also poses significant operational and technical challenges in model preprocessing aspects such as contact definition, meshing strategy, management, and post-processing analysis. Although ABAQUS provides a certain coupling-analysis framework, it still has limitations in simulation accuracy, computational efficiency, and direct interfacing with visual-sensing data for specific physical fields, often necessitating integration with specialized simulation tools or the development of custom co-simulation schemes. Therefore, future research should focus on establishing an automated and parametric modeling pipeline from visual data to analysis models, integrating multi-source information to achieve reasonable quantification of boundary conditions and loads, developing reduced-order and efficient numerical strategies for large structures, and carefully evaluating the applicable boundaries and enhancement pathways for extending ABAQUS to a broader range of engineering physical scenarios.
The core technical framework shows potential for expansion into advanced manufacturing fields such as aerospace and automotive engineering. In aerospace, this method could be used for digital inspection and performance evaluation of large composite parts of aircraft or rocket tanks. Assembly deviations or in-service deformation fields of complex surfaces can be obtained non-contact via a trinocular stereo vision system, and ABAQUS's advanced analysis capabilities for composites, anisotropic materials, and thermo-mechanical coupling scenarios can support structural health monitoring, maintenance decision-making, and lightweight design. In automotive engineering, it is suitable for dimensional quality inspection of body-in-white or chassis frames and virtual verification of structural stiffness and durability. By rapidly scanning the actual geometry of welded assemblies or stamped parts via the vision system, a high-fidelity finite element model incorporating weld details, material hardening effects, and contact nonlinearity can be established, thereby enabling more accurate early-stage predictions of static stiffness, crash safety, and fatigue life during product development, which helps reduce reliance on physical prototypes and accelerate R&D iteration. Cross-domain applications also face specific challenges, such as higher requirements for measurement accuracy and speed, more detailed descriptions of anisotropic and nonlinear materials, and simulation capabilities for complex working conditions such as dynamic high-frequency excitation and fluid-structure interaction. Future work could introduce higher-frame-rate vision sensors, integrate laser-scanning data to improve geometric-reconstruction accuracy, and further develop or integrate specialized material models and multidisciplinary simulation workflows tailored to composites and light alloys, thereby advancing the practical application of this method in high-end equipment design and manufacturing.
Funding
This research received no external funding.
Conflicts of interest
The authors have nothing to disclose.
Data availability statement
Raw data are available from the corresponding author upon request.
Author contribution statement
Writing—Original Draft Preparation: Chunhai Wang and Yanfeng Zhao; Writing—Review & Editing: Feng Li and Peng Zhou. All authors will have reviewed, discussed, and agreed to their individual contributions.
References
- M. Stodola, S. Frolík, Self-calibration method of binocular vision based on conformal geometric algebra, Math. Methods Appl. Sci. 47, 1289–1304 (2024) [Google Scholar]
- L. Kant, A. Samanta, Nonlinear analysis of building structures resting on soft soil considering soil-structure interaction and structure-soil-structure interaction, J. Inst. Eng. India Ser. A 105, 475–485 (2024) [Google Scholar]
- H. Safaei, E. Selahi, H. Fahham, M. Azadi, Finite element modeling of 3D stitch fabric textile in meso-scale under compression loading, Mech. Compos. Mater. 60, 977–986 (2024) [Google Scholar]
- P. Tecmer, M. Galynska, L. Szczuczko, Geminal-based strategies for modeling large building blocks of organic electronic materials, J. Phys. Chem. Lett. 14, 9909–9917 (2023) [Google Scholar]
- F. Cannizzaro, B. Pantò, S. Caddemi, I. Caliò, Discrete modelling of externally bonded composite layers on masonry structures, Compos. Struct. 315, 1.1–1.21 (2023) [Google Scholar]
- M.J.J. Bucher, M.A. Kraus, R. Rust, S. Tang, Performance-based generative design for parametric modeling of engineering structures using deep conditional generative models, Autom. Constr. 156, 105128.1–105128.20 (2023) [Google Scholar]
- G. Hunter, L. Djumas, B.A. Molotnikov, Modeling of 3D brick-and-mortar structures using cohesive zone finite elements, Adv. Eng. Mater. 26, 2301146-1–2301146-9 (2024) [Google Scholar]
- J. Shayanfar, J.A.O. Barros, M. Rezazadeh, Stress-strain model for FRP-confined circular concrete columns developing structural softening behavior, J. Compos. Constr. 28, 1.1–1.20 (2024) [Google Scholar]
- D. Addessi, P. Di Re, C. Gatta, E. Sacco, Non-uniform TFA reduced multiscale procedure for shell-3D modeling of periodic masonry structures, Mech. Res. Commun. 130, 1–10 (2023) [Google Scholar]
- L. Strauss, R. Walls, Modeling of composite structures in fire using a coupled skeletal frame and floor system analysis: slab panel method, J. Struct. Eng. 149, 4022235.1–4022235.13 (2023) [Google Scholar]
- A. Babar, H. Ghulam, M.B.I. Muhammad, Mechanical characterization of innovative 3D-printed auxetic (NPR) structures: role of considering anisotropy on accuracy of numerical modeling, Int. J. Adv. Manuf. Technol. 130, 4845–4859 (2024) [CrossRef] [Google Scholar]
- P.R. Prem, P.S. Ambily, S. Kumar, S.B. Ghodke, A theoretical model to predict the structural buildability of 3D printable concrete, Mech. Time-Depend. Mater. 28, 2661–2679 (2024) [Google Scholar]
- A. Akolu, J. D'Anna, R. Ramirez, F. Solarino, A. Romanazzi, M.P. Ciocci et al., Simulation of blind prediction and post-diction shaking table tests on a masonry building aggregate using a continuum modelling approach, Bull. Earthq. Eng. 22, 6163–6193 (2024) [Google Scholar]
- V.A. Zorin, N.T. Minh, Prediction of the residual service life of hydraulic motors of construction machines based on the results of simulation modeling, Steel Transl. 54, 676–680 (2024) [Google Scholar]
- R.B.A.D. Sousa, A.K. Leung, J.A. Knappett, X. Zhang, Strength and stiffness anisotropy of 3D-printed coarse root analogues for small-scale physical modelling, Geotech. Lett. 14, 139–144 (2024) [Google Scholar]
- E.I. Ramírez, R. Osvaldo, R.R. Carlos, O. Armando, Preform geometry determination for a connecting rod forging by CEL model in ABAQUS, Int. J. Adv. Manuf. Technol. 127, 5569–5576 (2023) [Google Scholar]
- D. Vigh, J. Xu, C.K. Glaccum, Sparse-node acquisition for data fitting velocity model building, Geophys. Prospect. 71, 1540–1550 (2023) [Google Scholar]
- G. Kerekes, V. Schwieger, An approach for considering the object surface properties in a TLS stochastic model, J. Appl. Geod. 18, 115–131 (2024) [Google Scholar]
- A.A. Movchan, A.M. Rikhmaer, Structural-simulation model for the deformation of shape memory alloys: I. Description of the orientational transformation effect, Russ. Metall. (Metally) 2024, 270–277 (2024) [Google Scholar]
- Y. Dong, Y. Yang, Simulation of digital reconstruction of building model based on improved minimum spanning tree, Comput. Simul. 40, 197–201 (2023) [Google Scholar]
- A.K. Legesse, B. Abera, A. Mekonnin, Effects of project management practices on the performance of Ethiopian National Stadium, Ethiop. J. Sport Sci. 5, 19–42 (2024) [Google Scholar]
- H. Mujtahid, S.V. Machdum, Dynamics of advocacy and community empowerment stage through the resettlement action plan program for the Kampung Bayam community in the construction of the Jakarta International Stadium project by PT Jakarta Propertindo, J. Indones. Sos. Sci. 5, 924–934 (2024) [Google Scholar]
- L.B. Rashid, A. Musah, R.K. Amoah, Technoeconomic feasibility of renewable energy systems for sporting stadiums, Int. J. Energy Res. 2025, 1–11 (2025) [Google Scholar]
Cite this article as: C. Wang, Y. Zhao, F. Li, P. Zhou: Three-dimensional modeling method of large football stadium frame structures based on trinocular stereo vision and ABAQUS. Sust. Build. 9, 4 (2026), https://doi.org/10.1051/sbuild/2026001.
All Tables
Comparison of simulated and measured stresses in key components of the grandstand frame structure.
Comparison of simulated and experimental hysteretic characteristics for concrete columns.
Comparison results of comprehensive performance of different three‑dimensional modeling methods.
All Figures
|
Fig. 1 Schematic of the coplanarity condition. |
| In the text | |
|
Fig. 2 Trinocular stereo vision model. |
| In the text | |
|
Fig. 3 Conventional optical axis intersection model. |
| In the text | |
|
Fig. 4 Flowchart of three‑dimensional modeling for large football stadium frame structures. |
| In the text | |
|
Fig. 5 Three-dimensional measurement results of the grandstand frame structure. |
| In the text | |
|
Fig. 6 Three-dimensional model of the large football stadium frame structure. |
| In the text | |
|
Fig. 7 Horizontal tensile stress of the grandstand frame structure. |
| In the text | |
|
Fig. 8 Hysteresis curve of horizontal load versus displacement for concrete columns in the frame structure. |
| In the text | |
|
Fig. 9 Relationship between base shear and roof displacement in the large football stadium frame structure. |
| In the text | |
Current usage metrics show cumulative count of Article Views (full-text article views including HTML views, PDF and ePub downloads, according to the available data) and Abstracts Views on Vision4Press platform.
Data correspond to usage on the plateform after 2015. The current usage metrics is available 48-96 hours after online publication and is updated daily on week days.
Initial download of the metrics may take a while.